Article created by Rainer Gerhards.
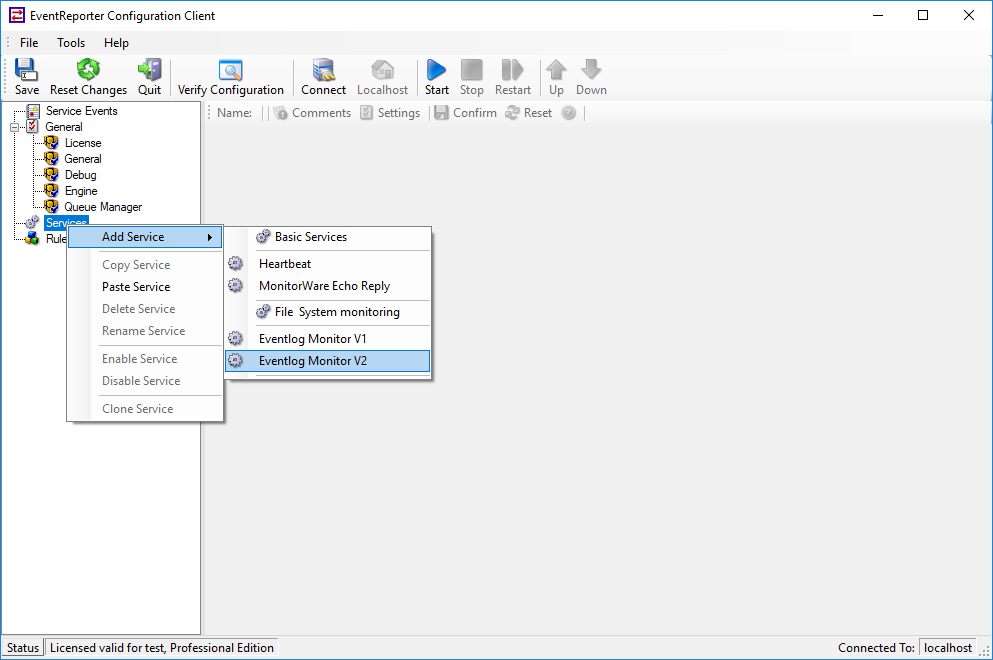
1. First, right click on “Services”, then select “Add Service” and then “Event Log Monitor”:

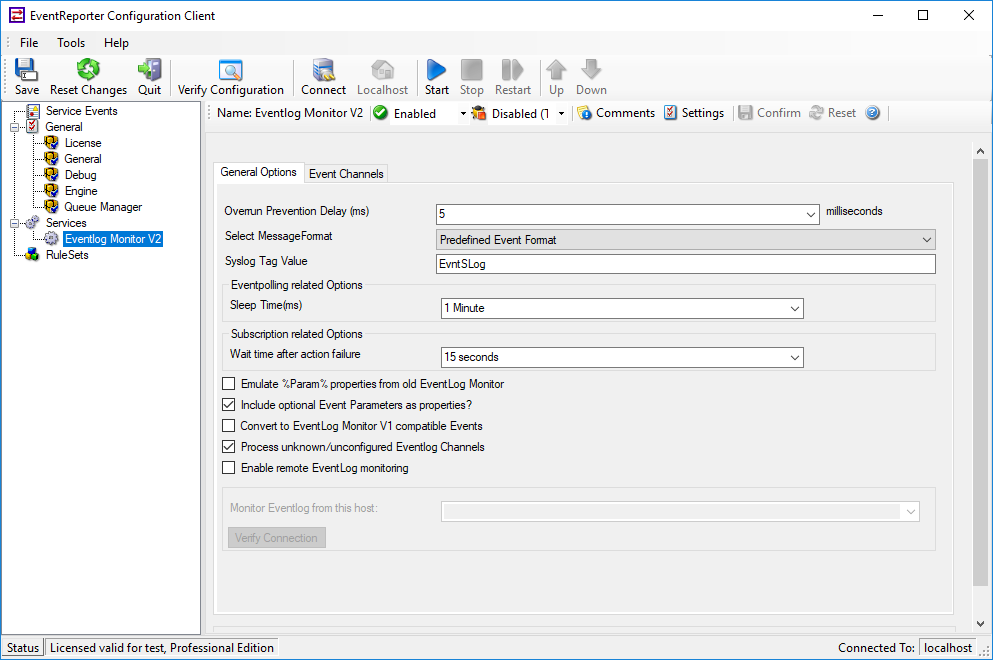
2. Now, you will see the newly created service beneath the “Services” part of the tree view. To check its parameters, select it:

As you can see, the service has been created with the default parameters.
Overrun Prevention Delay: This property allows configuring a delay after generating an event.
Select Message Format: With this option you can choose whether the Events will be extracted in “Raw XML Format” or in the “Predefined Event Format”.
SyslogTag Value: The SyslogTag Value determines the SyslogTag that is used when forwarding Events via syslog.
Sleep Time: This controls iteration over the configured channels. We suggest a value of 60 seconds for the “Sleep Time”. With that setting, the event log monitor checks for new events every 60 seconds.
For a more detailed description of all parameters take a look at the EventReporter manual.

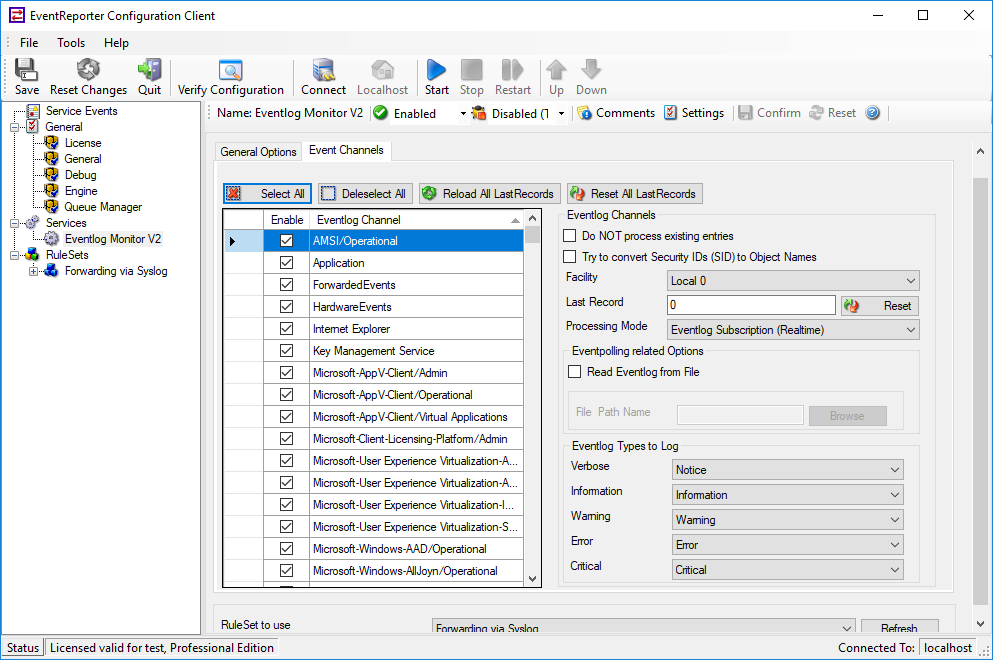
Note: The “Default RuleSet” has been automatically assigned as the rule set to use. By default, the wizard will always assign the first rule set visible in the tree view to new services. If you want to change it you can do that at the bottom of the configuration page.
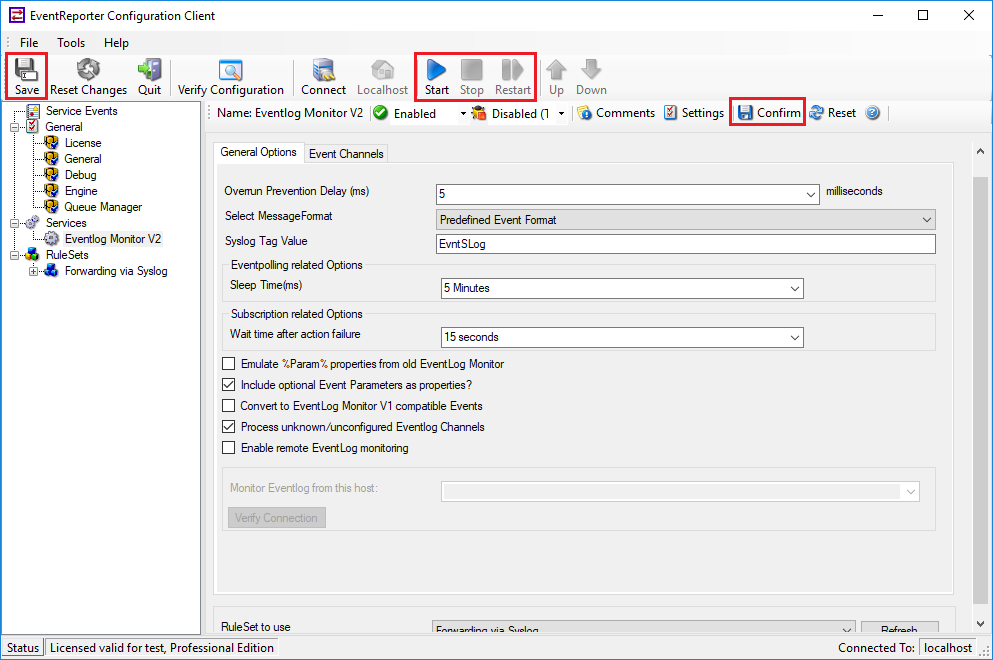
3. Finally, save the change and start EventReporter. This procedure completes the configuration of the syslog server.

EventReporter cannot dynamically read changed configurations. As such, it needs to be restarted after such changes. In our sample, the service was not yet started, so we simply need to start it. If it already runs, you need to restart it.