Article created by Rainer Gerhards.
The Windows event log provides multiple evidence of potential intrusions. We will discuss what to look for when checking the event log.
We have used Windows 10 while updating this text. There may be differences for other versions, so you might want to check if you are using a different environment.
Detecting Failed Logons
Numerous failed logons are a good indication that someone is trying to guess user passwords. This is typically done using a so-called “dictionary attack”, where a list of words often used as passwords (the dictionary) is simply tried on a given account. If the account password is carefully chosen, not only the dictionary attack fails but there are many failed logon events. Even if the password is contained in the dictionary, chances are quite good that it is not in the first 5 to 10 words the attacker tries. Windows allows you to lock out an account that has too many invalid password attempts. If the configured threshold is reached, the account will be disabled for a given period of time and Windows will also log event in the security event log.
Configuring Windows
By default, Windows does not check for those kind of attacks. It must be turned on by the administrator. This is done in the “Audit Policy” (part of the group policy set), configured with the “Group Policy Editor” administrative tool.
1.) Press Windows + R and enter “gpedit.msc”.
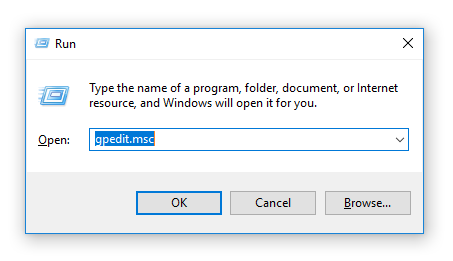
2.) After pressing the “OK” button the Local Group Policy Editor will open in a new window.
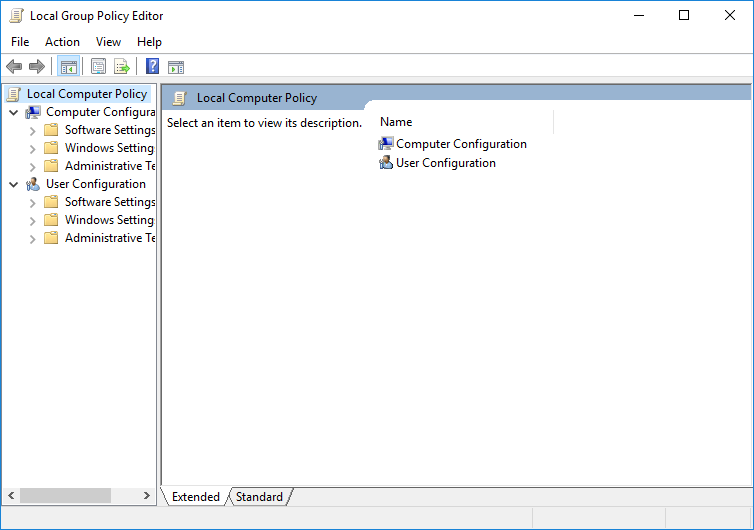
3.) Follow these points through the menu. “Computer Configuration” > “Windows Settings” > “Security Settings” > “Local Policies” > “Audit Policy”
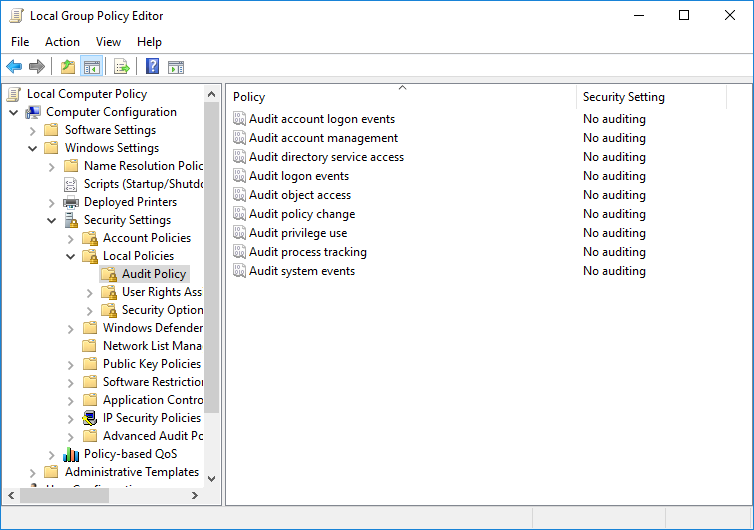
4.) Open “Audit logon events” with a double click and select both “Success” and “Failure”.
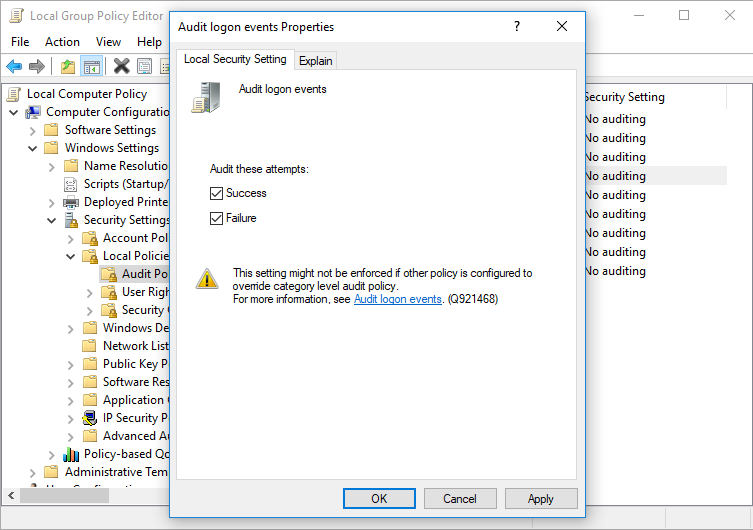
Confirm your settings by pressing the “OK” button. Now successful and failed logon attempts will be logged as an event.
Creating Rules for MonitorWare Agent
Now that we have the proper events present in the Windows Security Event Log, we can build MonitorWare Agent rules to detect unusual patterns. Please keep in mind that the rule set must be either bound to an event log monitor service or be included from another rule set that is bound to one. Without that, the rule set will not be executed. We will not explain this process here in this chapter. We just focus on the filters and rule set itself.
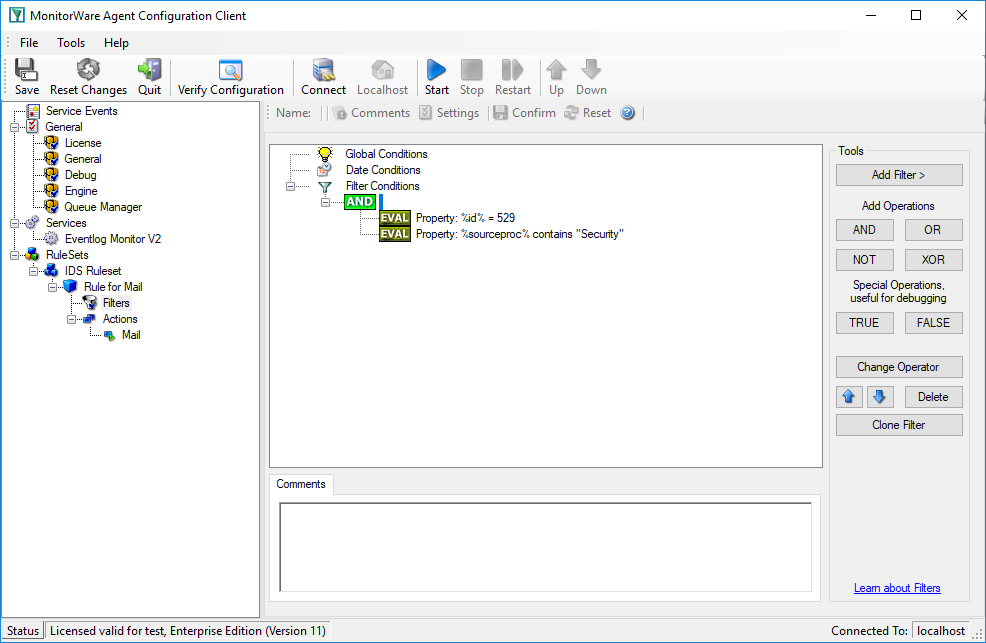
We will create a rule that fires if a logon failed (event id 529):
We use an email action to notify the admin once this happens:
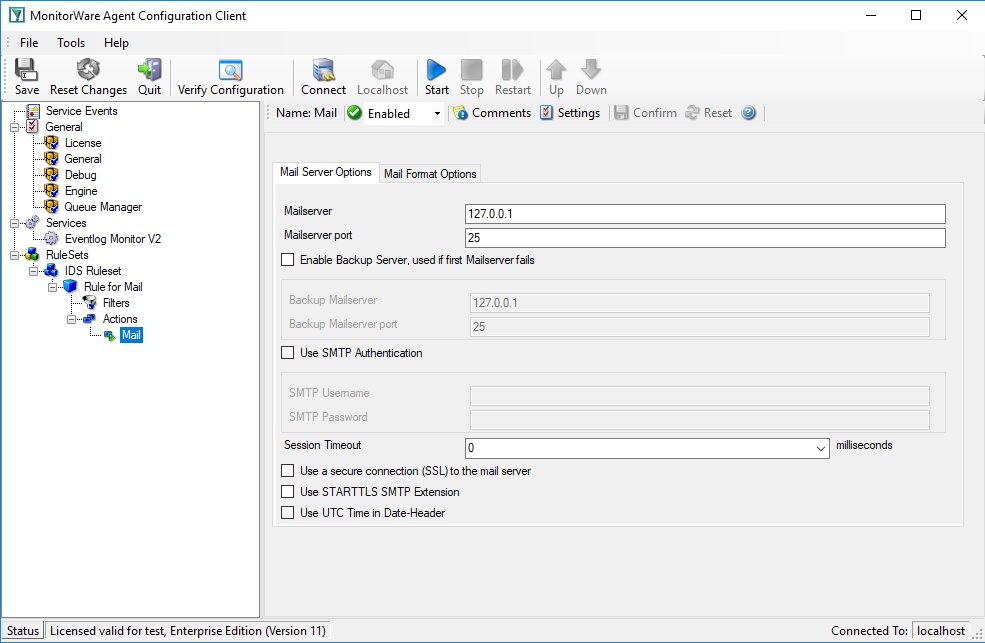
Of course, we could also have done other things. Good example might be sending a syslog message to a syslog server specifically monitoring such events. The proper action is mainly depending on your intended result.
This rule detects attacks that will lead to an account becoming locked out. It will also fire if a user actually mistypes his password often enough to become locked out. This rule does not help against attacks where the user id changes together with the password. There are some tools out doing so.
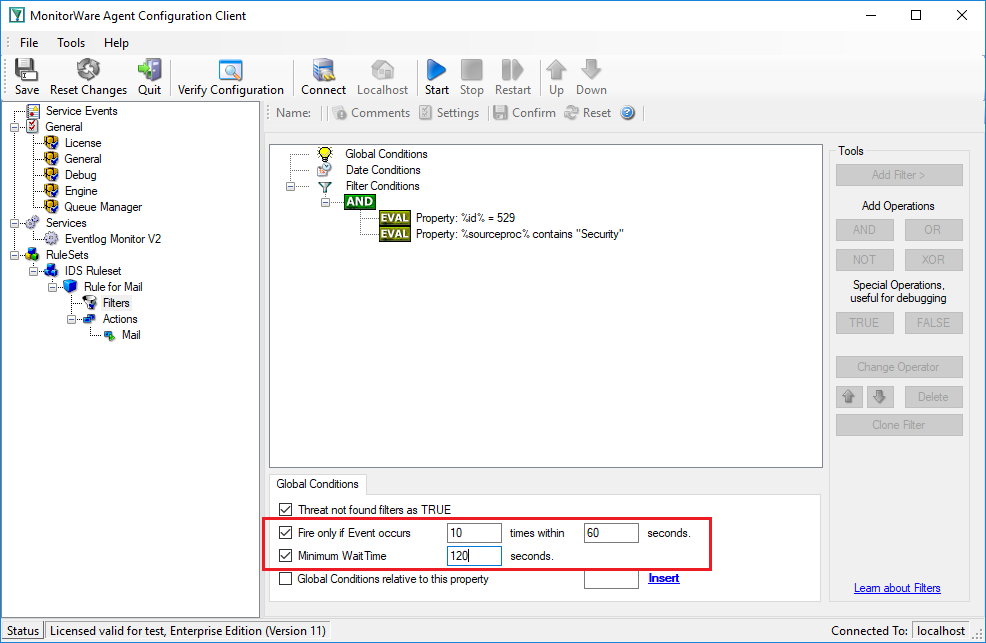
Fortunately, we can detect those attacks, too. The key to it is counting failed logons. If the number of failed logons reaches a threshold within a given amount of time, we can suspect that something is wrong. Of course, the threshold is different for different types of machines. A web server, for example, that is just serving web pages and where only administrators and web authors log on, the number of failed logons should be really low. On a busy file server, on the other hand, that threshold should probably be much higher. As such, the actual numbers we use in our sample here should be treated with care. They need to be replaced by some values that match your typical environment and expectations. If in doubt, consult your past event logs to find out what is normal.
We have two different event ids to look at: the 529 event is generated when somebody logs onto the machine itself. This must not be an interactive logon. It can also be a logon via the network, via the web server, the ftp server or any other logon that is done either by the user himself or a process on his behalf on the local machine.
There is also the 681 event. That event is logged whenever the security authority authenticates a user. This event typically is logged on domain controllers when domain users authenticate. A domain controller can log this event even when no local logon happens afterwards. Also, as any domain controller can authenticate a user, the 681 event can occur on every domain controller. Thus, the amount of those events on a single domain controller can not reliable be used to detect the threshold. On a stand-alone server, event 681 is logged together with 529.
For our needs, this means we should monitor the 529 event if we are interested in the local failed logon activity and the 681 if our scope is the network. In the later case, it might be helpful to ensure that security events from all domain controllers are passed to a central MWAgent. Only this ensures that MWAgent has the full overview over network logon activity.
Please note the red marked area. This is the important part here. The “Fire Only if Event Occurs” setting means that there must be at least 10 failed logons within 60 seconds. If there are fewer, the filter will not apply, even though the filter condition would otherwise apply. Similarly, the “Minimum Wait Time” specifies that at least 120 seconds need to have passed since the last time this filter condition fired. Again, if the last match was more recent, the filter condition as whole does not evaluate as true. So with the above filter, we will receive a notification at most once every 2 minutes (120 seconds).
Detecting Suspicious Configuration Changes
There are many opinions on what a suspicious configuration change might be. In this sample, we assume we are dealing with an already configured web server. It again is a stand-alone server. There is not much need for configuration changes once a machine has reached this stage. Obviously, some of the notifications we generate here are overdone on a typical domain controller. Nevertheless, the example should provide an idea of what to look for.
Events we are interested in are these:
- Account Management
- 624 – User Account Created
- 626 – User Account Enabled
- 627 – Password Change Attempted
- 628 – User Account Password Set
- 629 – User Account Disabled
- 630 – User Account Deleted
- 631 – Security Enabled Global Group Created
- 632 – Security Enabled Global Group Member Added
- 633 – Security Enabled Global Group Member Removed
- 634 – Security Enabled Global Group Deleted
- 635 – Security Enabled Local Group Created
- 636 – Security Enabled Local Group Member Added
- 637 – Security Enabled Local Group Member Removed
- 638 – Security Enabled Local Group Deleted
- 639 – Security Enabled Local Group Changed
- 641 – Security Enabled Global Group Changed
- 642 – User Account Changed
- 643 – Domain Policy Changed
- System Events
- 512 – Windows is starting up
- 513 – Windows is shutting down (you will probably not see this event before the system is restarted)
- 516 – Internal resources allocated for queuing of security event messages have been exhausted, leading to the loss of security event messages
- 517 – The security log was cleared
- Policy Change
- 608 – A user right was assigned
- 609 – A user right was removed
- 610 – A trust relationship with another domain was created
- 611 – A trust relationship with another domain was removed
- 612 – An audit policy was changed
- 768 – A collision was detected between a namespace element in one forest and a namespace element in another forest
Events in bold are uncommon on nearly all types of machines. Depending on the role a server is playing, events not shown in bold can occur as part of day-to-day operations. On such servers, they should obviously not trigger alarms. Again, on a fully configured web server in product, we would like to see neither of them.
We create two rules in MonitorWare Agent, one for the highly suspicious events and one for the others. Let’s start with the highly suspicious ones:
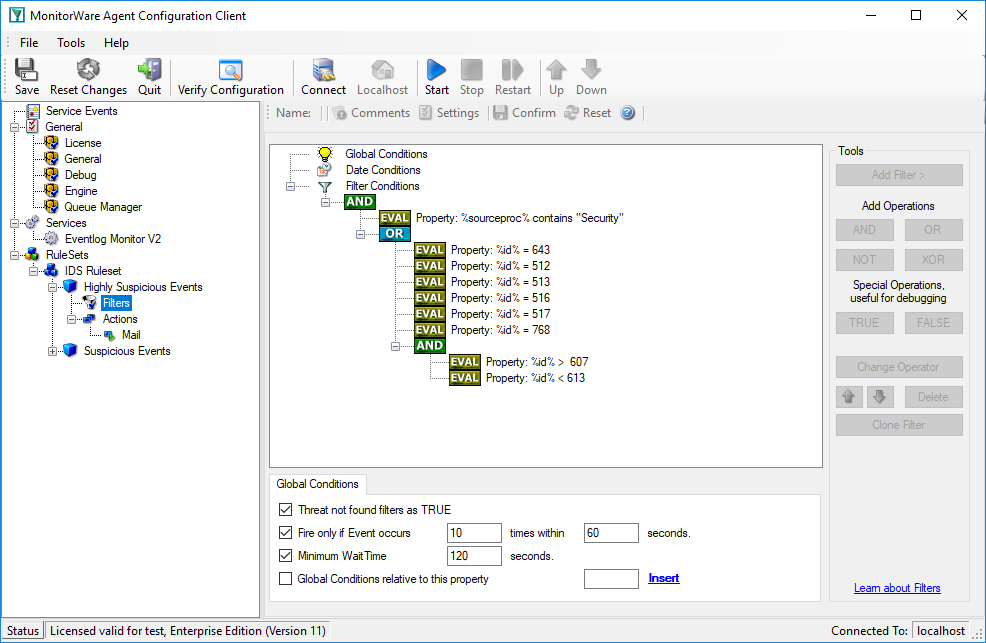
And this one holds the filter conditions for the other suspicious events:
